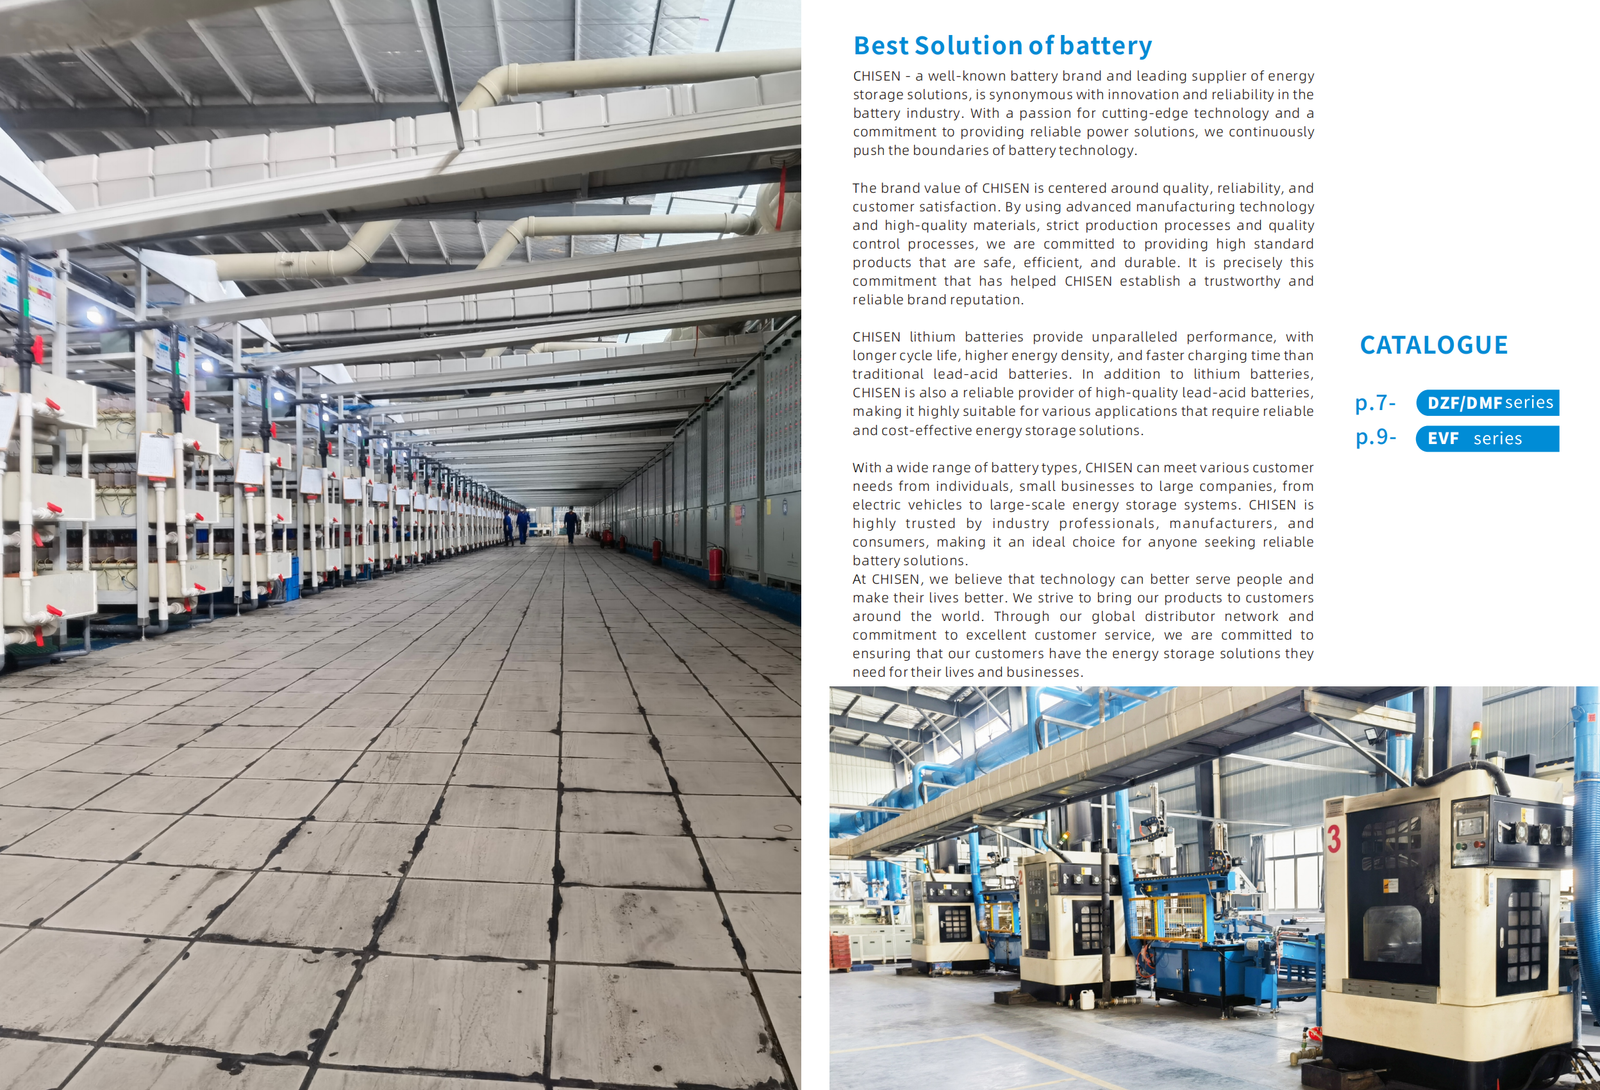
Lead acid Battery

  • Q006 Ups Battery Data Center

    UPS Battery Selection for Data Centers: Lead-Acid vs. Lithium in 2026

    Data center operators face a paradox in battery selection: the reliability requirements are among the highest of any application, yet the economic pressures to reduce both capital cost and operating expenses are intense. The battery system — typically representing 8–15% of total UPS system cost — is a critical decision point in data center design and procurement.

    UPS Battery Fundamentals

    A data center UPS system provides conditioned power to IT loads during grid outages, using battery banks as the energy storage medium. The battery bank must supply full load for the specified autonomy duration — typically 10–30 minutes for most facilities, long enough to start backup generators.

    Key UPS battery specifications:

    • Float voltage: The constant voltage at which the battery is maintained when fully charged (typically 2.25–2.30Vpc for VRLA at 25°C)
    • End-of-discharge voltage: The voltage at which the UPS disconnects the battery to prevent deep discharge damage (typically 1.67–1.75Vpc)
    • Short-circuit current: Critical for UPS system coordination; determines the maximum fault current the battery can supply
    • Charge acceptance: The rate at which the battery accepts charge after discharge — important for rapid recharging between generator startups

    VRLA AGM: The Dominant Data Center Technology

    AGM batteries hold approximately 90% of the data center UPS battery market globally. Their characteristics are well-suited to the application: sealed design eliminates maintenance, they can be installed in standard server room environments without specialized ventilation, and they are available in configurations specifically rated for high-rate UPS discharge (up to 15-minute autonomy at high discharge rates).

    Typical configurations for data centers:

    • 12V 7–230Ah VRLA blocks for small UPS systems (up to 40kVA)
    • 2V cell strings (100–3,000Ah) for large UPS systems (above 40kVA)

    Strengths:

    • Mature, well-understood technology with 30+ year deployment history in data centers
    • No maintenance required for AGM configurations
    • Short recharge time: can accept high-rate charging to restore 95% capacity within 8–10 hours
    • Lower upfront cost than lithium for most configurations
    • Wide range of IEC 60896-21/22 compliant products from established manufacturers

    Limitations:

    • Limited cycle life: 500–800 cycles at rated high-rate discharge for standard AGM; high-rate AGM configurations (HR, LHK) specifically designed for UPS applications extend this to 800–1,200 cycles
    • Temperature sensitive: float life halves for every 10°C above 25°C ambient
    • Weight: significantly heavier than lithium equivalents

    Lithium Iron Phosphate (LFP) in Data Centers

    LFP batteries have entered the data center market over the past 3–4 years, initially in colocation facilities and edge computing nodes, and increasingly in enterprise data centers. The drivers are compactness, longer cycle life, and declining cost.

    Strengths:

    • Compact: approximately 60% of the weight and volume of equivalent VRLA capacity
    • Long cycle life: 5,000–8,000 cycles at 80% DoD
    • Consistent voltage output across discharge curve, simplifying UPS sizing
    • Lower TCO for edge and colocation facilities with frequent utility transitions

    Limitations:

    • Higher upfront cost: $250–450 per kWh vs. $100–180 for VRLA
    • Requires temperature management: LFP performs optimally at 20–30°C; below 0°C or above 45°C requires heating/cooling systems
    • BMS integration complexity: requires communication with UPS system for monitoring and safety management
    • Regulatory uncertainty: building codes and fire safety regulations for lithium battery installations in data centers vary by jurisdiction

    Data Center Battery Selection Framework

    For most enterprise and colocation data centers, VRLA AGM remains the recommended technology in 2026. The key selection criteria are:

    Tier II–III facilities with standard autonomy requirements (10–15 minutes): standard VRLA AGM, specifically high-rate AGM (LHK type) for UPS applications.

    Edge computing nodes with limited floor space and moderate autonomy: LFP where floor space constraints justify the cost premium.

    Hyperscale facilities: LFP for new constructions where the TCO model over 10+ years justifies the upfront premium.

    CHISEN’s data center UPS battery range includes IEC 60896-21/22 compliant 2V VRLA cells and 12V AGM blocks in all standard configurations, with UN38.3 certification for international transport.

    📧 Email: sales@chisen.cn | 📱 WhatsApp: +86 131 6622 6999 | 🌐 www.chisen.cn

  • Q005 Africa Telecom Battery 2026

    Africa Telecom Battery Market 2026: Nigeria, Kenya, South Africa Infrastructure Expansion Analysis

    Sub-Saharan Africa is adding approximately 25,000–35,000 new telecom towers annually, according to the GSMA — making it the highest-growth telecom infrastructure market in the world. Every new tower requires a backup battery system. This translates to an annual demand for approximately 4–6 million ampere-hours of telecom backup batteries across the continent.

    For battery importers and distributors, understanding the geographic concentration of this demand — and the specific requirements of each market — is essential for building a competitive supply business.

    Nigeria: The Continent’s Largest Single Market

    Nigeria operates approximately 45,000 telecom towers, with tower companies including IHS Towers (managing 23,000+ sites), ATC Nigeria, and Gigaton Towers. The country is the continent’s largest telecom battery market by volume.

    Grid reliability: 60–80% nationally, with significant regional variation. Rural Northern states (Katsina, Kebbi, Sokoto) experience availability below 65%, while Lagos and Abuja urban areas achieve 88–94%. This grid unreliability creates the highest per-tower battery autonomy requirements in Africa: operators in Northern Nigeria typically specify 10–15 hours backup.

    Battery standard: 48V configurations dominate (four 12V 200Ah blocks in series, or 24 × 2V 200Ah cells). OPzV tubular GEL is the preferred chemistry due to hot-climate performance requirements.

    Import pathway: Lagos Port. SONCAP certification from an accredited inspection company (SGS, Bureau Veritas, or Intertek) is mandatory prior to shipment. Commercial invoices must be denominated in USD; naira exchange rate volatility is a key cost risk factor for importers.

    Kenya: East Africa’s Distribution Hub

    Kenya’s telecom sector serves as a distribution gateway for Uganda, Tanzania, Rwanda, and South Sudan. Nairobi-based tower companies including Beecomm, 8tel, and Eaton Towers manage approximately 8,500 sites nationally.

    Grid reliability: Nairobi and Mombasa urban areas achieve 92–96% availability. Rural areas — particularly in the Rift Valley and Northern Kenya — drop to 75–85%. Operators serving rural Kenya specify 8–12 hours of battery backup autonomy.

    Import pathway: Mombasa Port. KEBS PVOC certification is mandatory for battery imports; a valid Certificate of Conformity must be obtained before shipment. Kenya’s position as East Africa’s logistics hub creates opportunity for distributors who can supply both Kenya’s domestic market and cross-border into Uganda, Tanzania, Rwanda, and South Sudan.

    Market opportunity: Kenya’s renewable energy targets include 100% green energy for telecom towers by 2030, driving hybrid solar-battery deployments that create additional demand for high-quality deep-cycle batteries.

    South Africa: Load-Shedding Drives Battery Demand

    South Africa presents a unique telecom battery market: grid reliability is generally good in urban areas, but scheduled load-shedding (despite being scaled back) and the underlying generation capacity crisis mean that most telecom operators maintain 6–10 hours of battery backup as standard.

    Tower count: approximately 55,000–60,000 total sites. Key tower companies: ATC South Africa, BALDWIN, and independent tower companies.

    The South African telecom battery market has the continent’s highest quality requirements: SABS certification is mandatory for most government and large corporate contracts, and operators frequently require IEC 60896 compliance.

    Import pathway: Durban Port (primary) and Cape Town Port. SABS certification required; NRCS type approval mandatory for certain categories. South Africa offers the most transparent regulatory environment for battery imports on the continent, but also the most stringent quality requirements.

    East and Central Africa Expansion Markets

    Tanzania: Approximately 12,000 towers. Grid availability 85–92%. Port of Dar es Salaam serves as a key import hub for Tanzania, Zambia, and DRC. TBS conformity marking required.

    Uganda: Approximately 7,000 towers. Grid availability 82–90%. Kampala is the primary market center. UNBS certification required. Uganda’s position as a trade gateway to Rwanda, South Sudan, and eastern DRC creates cross-border distribution opportunity.

    Democratic Republic of Congo: Approximately 5,000 towers. Highly challenging logistics environment; most imports route via Dar es Salaam or Durban with overland transport. Extremely high battery demand per site due to extremely unreliable grid (65–75% availability). Premium pricing achievable for reliable supply.

    CHISEN Africa Telecom Solutions

    CHISEN has supplied telecom batteries to 18 African markets, with dedicated export documentation packages for SONCAP (Nigeria), KEBS PVOC (Kenya), SABS (South Africa), TBS (Tanzania), and UNBS (Uganda). The Africa telecom range includes OPzV 2V cells and AGM VRLA 12V blocks configured for all standard 48V, 72V, and 120V telecom systems.

    📧 Email: sales@chisen.cn | 📱 WhatsApp: +86 131 6622 6999 | 🌐 www.chisen.cn

  • Q004 Forklift Battery Guide

    Industrial Forklift Battery Guide: Lead-Acid vs. Lithium for Warehouse Operations

    Forklift fleets represent one of the most demanding applications for industrial batteries. Unlike stationary backup power, forklift batteries undergo deep daily cycling, experience high vibration and shock loads, and require rapid opportunity charging in multi-shift operations. Getting the battery selection right determines whether your warehouse operation runs efficiently or faces costly unplanned downtime.

    Forklift Battery Fundamentals

    Counterbalance forklifts typically operate on 48V traction battery systems, with capacities ranging from 300Ah to 900Ah depending on lift capacity and shift duration. A standard 3-tonne electric forklift requires a 48V 600Ah battery bank, weighing 1,500–2,200 kg.

    The key distinction between forklift battery types is cycle duty:

    • Class I (electric counterbalance): Heavy-duty daily cycling, 1–2 full cycles per shift, 250+ operating days per year
    • Class II/III (reach trucks, pallet jacks): Moderate cycling, opportunity charging, typically 1.5–2 shifts per day
    • Automated guided vehicles (AGV): High-frequency opportunity charging, specialized battery requirements

    Lead-Acid Traction Batteries: The Proven Standard

    Lead-acid traction batteries have powered industrial forklifts since the 1940s, and remain the dominant technology in most warehouse operations globally. The reasons are straightforward: proven reliability, low upfront cost, and a mature service infrastructure.

    Strengths:

    • Low upfront cost: $150–300 per kWh for quality traction batteries
    • Proven reliability: 15,000+ hours of operational data across global fleet
    • Fast opportunity charging: can be opportunity charged without damage (unlike some lithium chemistries)
    • Established second-life market: used traction batteries find applications in renewable storage
    • Robust design: specifically engineered for shock, vibration, and daily deep cycling

    Limitations:

    • Weight: a 48V 600Ah lead-acid traction battery weighs 1,500–1,800 kg, limiting application in weight-sensitive operations
    • Charge time: full charge requires 8–12 hours; opportunity charging partially addresses this
    • Maintenance: flooded lead-acid batteries require weekly watering; VRLA AGM is maintenance-free but more expensive

    Lithium Iron Phosphate (LFP) Forklift Batteries

    LFP batteries have gained significant market share in forklift applications over the past five years, driven by their performance advantages in specific operational scenarios.

    Strengths:

    • Rapid charging: 1–2 hour full charge vs. 8–12 hours for lead-acid — enables single-battery operation in multi-shift facilities
    • No maintenance: eliminates battery watering labor and acid handling
    • Compact and lightweight: approximately 40% lighter than equivalent lead-acid, beneficial for reach trucks and lightweight applications
    • Long cycle life: 4,000+ cycles vs. 1,200–1,500 for lead-acid traction batteries

    Limitations:

    • Higher upfront cost: $400–700 per kWh vs. $150–300 for lead-acid
    • Opportunity charging constraint: LFP requires controlled charging; opportunity charging must be managed by BMS
    • Thermal management: LFP generates heat during fast charging; ventilation requirements in enclosed spaces
    • Replacement cost: a failed LFP battery pack costs $15,000–25,000 to replace vs. $8,000–12,000 for lead-acid

    TCO Analysis: Multi-Shift Operation

    For a warehouse operating three shifts (24-hour operation):

    A lead-acid fleet with 5 counterbalance forklifts: battery investment $40,000–60,000, requiring 7–8 batteries per forklift (rotating set), total battery investment $280,000–480,000 over 5 years, including replacements.

    An LFP fleet with the same 5 forklifts: battery investment $120,000–200,000, requiring 1–1.5 batteries per forklift (opportunity charging enables single-battery operation), total battery investment $120,000–300,000 over 5 years.

    The crossover point: LFP delivers lower TCO for 24-hour multi-shift operations. For single-shift operations, lead-acid typically delivers superior TCO.

    CHISEN Industrial Traction Battery Range

    CHISEN offers industrial traction batteries purpose-built for forklift and warehouse vehicle applications: 2V traction cells in 300–1,500Ah capacities for 24V, 36V, 48V, 72V, and 80V systems. Certified to IEC 60254 standards, with global warranties and technical support.

    📧 Email: sales@chisen.cn | 📱 WhatsApp: +86 131 6622 6999 | 🌐 www.chisen.cn

  • Q003 E Bike Se Asia 2026

    E-Bike Battery Market in Southeast Asia 2026: Thailand, Vietnam, Indonesia Growth Analysis

    Southeast Asia is the world’s fastest-growing e-bike and electric three-wheeler market, driven by fuel cost economics, urban congestion, and government promotion of electric mobility. Lead-acid batteries are the dominant energy storage technology for first-generation e-bikes in this region — a market dynamic that creates significant opportunity for regional distributors.

    Market Overview

    The Association of Southeast Asian Nations (ASEAN) region — home to 700 million people — has seen e-bike and e-motorcycle registrations grow from approximately 2 million vehicles in 2020 to over 12 million in 2025. Thailand, Vietnam, and Indonesia are the three largest markets, collectively accounting for 75% of regional e-bike registrations.

    The dominant e-bike type in Southeast Asia is the electric motorcycle or e-motorcycle, operating at speeds of 25–60 km/h with a range of 40–100 km per charge. Lead-acid batteries — typically 48V 20Ah or 60V 20Ah configurations — dominate first-generation vehicles due to significantly lower upfront cost versus lithium alternatives.

    Thailand

    Thailand’s e-bike market has grown 40% annually since 2022, driven by government subsidies under the EV30@30 campaign targeting 30% EV penetration by 2030. Bangkok’s dense traffic and high fuel costs make e-motorcycles an increasingly attractive option for commuters.

    Battery demand: 60V 20Ah lead-acid packs are the standard configuration, priced at THB 8,000–14,000 ($220–390) per pack. Market size: approximately 800,000 vehicles registered, with 300,000+ new registrations expected in 2026. Total battery demand: 6–8 million Ah annually.

    Importers should note: Thailand’s Board of Investment (BOI) offers incentives for local EV battery manufacturing, creating opportunity for knock-down (KD) kit suppliers.

    Vietnam

    Vietnam has the highest e-bike penetration rate in Southeast Asia, with over 4 million registered e-bikes as of 2025, concentrated in Ho Chi Minh City and Hanoi. The Vietnamese e-bike market is almost entirely lead-acid powered — lithium e-bikes represent less than 5% of the market.

    Battery standard: 48V 12Ah and 48V 20Ah configurations are most common. Annual battery replacement demand is significant, as lead-acid e-bike batteries require replacement every 12–18 months in tropical Vietnamese conditions.

    Key opportunity: Vietnam currently imports approximately 60% of its lead-acid e-bike batteries from China. Distributors who can supply equivalent quality at competitive prices with shorter lead times have significant market opportunity.

    Indonesia

    Indonesia’s e-bike market is in an early but accelerating growth phase. Jakarta’s notorious traffic congestion and fuel costs of $0.80–1.20 per liter create compelling economics for e-motorcycles. The government has launched the Accelerated EV Program with tax incentives for electric vehicles.

    Battery standard: 48V and 60V configurations. Market is currently supplied primarily by local assembly operations using imported Chinese battery modules.

    Key opportunity: The Indonesian government’s local content requirements for EV subsidies favor distributors who can supply batteries for local assembly operations. SNI certification required for all batteries sold in Indonesia.

    Battery Chemistry by Segment

    Lead-acid dominates all three markets for first-generation e-bikes (below $1,500 vehicle price). Lithium penetration is growing in premium e-bikes ($2,000+) and shared fleet applications where total cost of ownership over 3+ years favors lithium.

    CHISEN’s e-mobility battery range — available in 48V, 60V, and 72V configurations — is specifically engineered for Southeast Asian tropical operating conditions with enhanced heat tolerance and vibration resistance.

    📧 Email: sales@chisen.cn | 📱 WhatsApp: +86 131 6622 6999 | 🌐 www.chisen.cn

  • Q002 Solar Ess Battery Guide

    Solar Storage ESS Battery Selection Guide 2026: Sizing, Chemistry, and TCO

    Energy storage systems (ESS) represent the fastest-growing application for deep-cycle batteries globally. Whether for a residential solar installation in Brazil, a commercial micro-grid in Nigeria, or a telecom tower hybrid system in Indonesia, the battery chemistry and capacity decisions made at the design stage determine the economics of the entire installation for 8–15 years.

    ESS Architecture Fundamentals

    A solar-plus-storage ESS system consists of: solar array → charge controller → battery bank → inverter → AC load. The battery sits at the heart of this system, and its selection determines three critical parameters: system availability (hours of backup), total cost of ownership, and maintenance requirements.

    Battery capacity for ESS is specified in kilowatt-hours (kWh) or ampere-hours (Ah) at a given voltage and depth of discharge. The relationship between kWh and Ah is: kWh = Volts × Ah.

    For a 48V system: a 400Ah battery bank provides 48 × 400 = 19,200Wh = 19.2kWh of rated capacity.

    Sizing Methodology

    ESS battery sizing follows a four-step process:

    Step 1: Calculate daily energy demand — Total watt-hours consumed per day across all loads, including inverter efficiency losses (typically 90–95%).

    Step 2: Determine autonomy requirement — How many days of backup required? For grid-interactive systems, 0.5–1 day is typical. For off-grid systems, 2–5 days depending on solar resource reliability and load criticality.

    Step 3: Apply depth of discharge constraint — Available capacity = rated capacity × maximum DoD. For lead-acid in solar cycling: 50% DoD maximum for long life; 60% DoD acceptable for cost-optimized systems.

    Step 4: Select battery voltage and configuration — Higher voltage systems (48V vs 24V) reduce current, losses, and cable cost, but require more cells in series.

    Chemistry Comparison for ESS Applications

    Lead-Acid AGM

    Best for: residential solar, small commercial systems, budget-constrained projects.

    Strengths: low upfront cost, mature technology, wide supplier base, excellent recycling infrastructure.

    Limitations: limited cycle life, temperature sensitivity, weight.

    Cost range: $100–180 per kWh installed.

    Lead-Acid OPzV Tubular GEL

    Best for: commercial and industrial solar systems, off-grid installations, hot-climate applications.

    Strengths: superior cycle life, excellent deep discharge recovery, hot-climate performance, 10+ year service life.

    Cost range: $150–250 per kWh installed.

    Lithium Iron Phosphate (LFP)

    Best for: high-cycle applications, space-constrained sites, cold-climate systems.

    Strengths: 6,000+ cycle life, compact, high charge acceptance.

    Cost range: $350–600 per kWh installed.

    TCO Comparison: 10kWh Residential System

    For a 10kWh residential solar-plus-storage installation in Lagos, Nigeria:

    AGM system: $1,500–2,000 battery cost, 4–6 year service life, 3–4 replacements over 15 years, total battery TCO: $6,000–9,000.

    OPzV GEL system: $2,000–3,000 battery cost, 8–10 year service life, 1–2 replacements over 15 years, total battery TCO: $3,500–6,000.

    LFP system: $5,000–7,000 battery cost, 12–15 year service life, 0–1 replacement over 15 years, total battery TCO: $5,000–9,000.

    The OPzV GEL system delivers the lowest TCO for this application.

    CHISEN ESS Battery Solutions

    CHISEN offers complete ESS battery ranges for all solar storage applications: AGM VRLA for residential and budget systems, OPzV tubular GEL for commercial and industrial ESS, and custom configurations for utility-scale storage projects.

    📧 Email: sales@chisen.cn | 📱 WhatsApp: +86 131 6622 6999 | 🌐 www.chisen.cn

  • Q001 Lead Acid Price Forecast 2026

    Lead-Acid Battery Price Forecast 2026: What Tender Buyers and Importers Need to Know

    Lead-acid battery prices in 2026 are shaped by a confluence of macro trends: rising lead costs, tightening environmental regulations in China — the world’s dominant lead-acid battery manufacturing base — and growing demand from solar storage, telecom, and e-mobility sectors. For procurement managers, tender buyers, and importers, understanding these price dynamics is essential for negotiating favorable contracts and timing purchases strategically.

    Lead Raw Material Cost Trends

    Lead accounts for 60–70% of the production cost of a lead-acid battery. The London Metal Exchange (LME) three-month lead price has traded in a range of $2,000–2,600 per metric ton through 2025, with upward pressure building as Chinese smelting capacity faces environmental compliance pressures.

    Key supply factors for 2026:

    • China produced approximately 5.4 million metric tons of refined lead in 2025, with environmental inspection campaigns periodically reducing output
    • Secondary (recycled) lead production accounts for 45% of Chinese supply, with recycling rates rising
    • Global lead concentrate supply is constrained by limited new mine development, with major projects delayed by permitting and capital constraints
    • Indian and Vietnamese demand for lead is growing, adding competitive pressure on supply

    The price outlook for 2026: LME lead prices are forecast to trade between $2,200–2,800 per metric ton, representing a 5–15% increase over 2025 average prices.

    Battery Price Movement by Segment

    Telecom Battery Prices

    High-cycle OPzV tubular GEL batteries (2V cells, 200–1,000Ah): prices expected to increase 5–8% in 2026 due to rising lead costs and tightening Chinese manufacturing capacity. For a 48V 800Ah telecom battery bank (4 × 200Ah strings), the price range shifts from $4,500–6,500 in 2025 to approximately $4,800–7,000 in 2026.

    AGM VRLA batteries for telecom: prices more stable, with 3–5% increases forecast. AGM production is more automated, with labor cost inflation the primary driver rather than raw material.

    Solar Storage Battery Prices

    Deep-cycle batteries for solar storage applications face more significant price pressure than telecom batteries, as the solar segment attracts more competitive bidding and Chinese manufacturers have aggressively priced into African and Asian markets. 48V 200Ah solar battery banks: price range $800–1,400 per unit in 2026, up from $750–1,300 in 2025.

    Premium OPzV batteries for solar: $150–250 per kWh across most configurations. The premium over standard AGM is compressing slightly as Chinese OPzV manufacturing scales.

    E-Mobility Battery Prices

    Electric three-wheeler (e-rickshaw) batteries: 12V 150Ah deep-cycle units priced at $120–180 per unit in 2026, relatively stable as this segment is heavily price-competitive and manufacturers have absorbed much of the raw material cost increase.

    Impact of Chinese Manufacturing Policy

    China’s Ministry of Ecology and Environment has tightened enforcement of lead battery manufacturing environmental standards, particularly in Jiangxi, Henan, and Hebei provinces — the traditional centers of Chinese lead-acid battery production. The result is a gradual consolidation of manufacturing capacity toward larger, compliant producers, and upward pressure on production costs.

    For international buyers, this has two important implications:

    First, supplier consolidation: the number of compliant, export-capable Chinese lead-acid battery manufacturers has declined from approximately 400 in 2020 to approximately 280 in 2025. By 2027, the market is expected to consolidate further to approximately 200 producers. This consolidation reduces buyer leverage with the largest manufacturers while creating opportunity with mid-tier exporters seeking market share.

    Second, quality upgrading: surviving Chinese manufacturers have invested in automated production lines and quality certification, improving consistency of output. The quality gap between Chinese and Japanese or European manufacturers is narrowing for most commercial applications.

    Regional Price Variations for Importers

    Battery prices at destination vary significantly based on import corridor:

    Import CorridorDuty RateLogistics CostDestination Premium
    Nigeria (Lagos Port)0–10% + VAT$400–800 per TEU15–25%
    Kenya (Mombasa Port)0% (under EAC)$300–600 per TEU10–18%
    South Africa (Durban)10–20% + VAT$200–400 per TEU8–15%
    UAE (Dubai/Jebel Ali)5%$150–300 per TEU5–12%
    India (JNPT Mumbai)18% GST$200–500 per TEU12–20%

    Importers in Nigeria face the highest effective landed cost due to SONCAP certification requirements and port handling charges, but Lagos-based importers benefit from proximity to the largest West African consumer market and duty exemptions for certain renewable energy equipment.

    Tender Pricing Strategy for 2026

    For procurement teams preparing tender submissions:

    Budget 8–12% above 2025 prices as your base case for lead-acid battery tenders in 2026. Lock in supplier quotes for no more than 60–90 days given price volatility. Consider split-award tender structures with price escalation clauses tied to LME lead prices for contracts extending beyond 6 months.

    CHISEN Battery provides fixed pricing quotes valid for 30 days for confirmed orders, with price adjustment provisions for contracts exceeding 90 days delivery lead time.

    📧 Email: sales@chisen.cn | 📱 WhatsApp: +86 131 6622 6999 | 🌐 www.chisen.cn

  • Pakistan Solar K Electric Battery Procurement 2026 06

    Pakistan Solar K-Electric Battery Procurement Guide 2026: Industrial Backup Power for Karachi Grid Outages

    Target Keyword: Pakistan solar battery K-Electric 2026

    Article Type: Industry Solution

    GEO: Karachi, Lahore, Islamabad, Faisalabad, Rawalpindi, Multan, Peshawar, Hyderabad, Quetta

    Date: 2026-06-19

    > A complete procurement guide for industrial battery storage in Pakistan 2026, covering K-Electric and national grid backup requirements, hybrid solar-plus-storage configurations, and OPzV versus LFP chemistry trade-offs for Karachi 50°C ambient conditions.

    Key Takeaways

    • K-Electric Karachi serves 25 million consumers with average 4–6 hours of load-shedding daily through 2025 and into H1 2026
    • Pakistan solar PV installations grew 31% year-over-year in 2025, with 2.8 GW of new capacity added
    • Industrial battery backup is mandatory for textile, pharmaceutical, food processing, and dairy operations
    • OPzV tubular gel remains the optimal chemistry for hybrid solar-plus-storage projects below 5 MWh in Karachi 50°C ambient
    • CHISEN maintains Karachi bonded inventory with 7-day delivery to Pakistan industrial customers

    Quick Specifications — Battery Options for Pakistan Industrial Backup

    Battery FamilyCapacity RangeCycle Life at 50% DoD, 45°COperating TempBest Pakistan Use Case
    OPzV Tubular Gel (2V 200–3000Ah)2V cells, 4–48V systems1,600–2,000 cycles-20°C to +45°CTextile mills, pharma, food processing
    OPzS Tubular Flooded (2V 200–3000Ah)2V cells, 4–48V systems2,200–2,700 cycles-10°C to +45°CLarge textile mills with water service
    LFP 51.2V Rack (100–280Ah)5.12 kWh3,500–4,500 cycles-10°C to +55°C (with thermal mgmt)Air-conditioned control rooms, data centers
    GFM Carbon-enhanced VRLA2V 200–2000Ah1,300–1,600 cycles-20°C to +40°CSmall commercial, telecom backup
    Tubular Tall Flooded (TTF)12V 100–200Ah600–800 cycles0°C to +45°CEntry-level solar home systems

    The Pain: Pakistan Industrial Power Crisis in 2026

    Pakistan’s industrial sector faces one of the world’s most severe power reliability challenges. Through 2025 and into H1 2026, the national grid operated at cumulative 4–8 hours of load-shedding daily across most industrial zones, with Karachi’s K-Electric serving 25 million consumers experiencing average 4–6 hours of unscheduled outages per day.

    Three forces drive industrial battery backup demand in Pakistan:

    First, K-Electric reliability crisis. K-Electric’s transmission and distribution infrastructure, much of it 30–40 years old, struggles to meet Karachi’s 4,000–5,000 MW peak demand. Industrial customers in SITE (Sindh Industrial Trading Estate), Korangi Industrial Area, Landhi Industrial Area, and Faisal Industrial Zone experience 4–8 hours of unscheduled outages daily, plus 6–12 hours of scheduled load-shedding during summer months (May–September).

    Second, solar PV deployment acceleration. Pakistan crossed 13 GW of cumulative solar PV capacity in 2025, with the World Bank and Asian Development Bank financing another 4–6 GW of utility-scale solar through 2027. Industrial customers are increasingly co-locating solar PV with battery storage to achieve 60–90% renewable penetration and reduce grid dependence.

    Third, Pakistan textile industry competitiveness. Pakistan’s textile sector contributes 8.5% of GDP and 60% of export earnings. The sector is highly time-sensitive — a single 4-hour power outage during a dyeing cycle can ruin an entire batch worth PKR 5–15 million. Battery backup has become a competitive necessity rather than an optional investment.

    The Choice: OPzV vs LFP for Pakistan Industrial Backup

    For Pakistan industrial battery backup projects below 5 MWh, OPzV tubular gel is the optimal chemistry. For above 10 MWh with active cooling infrastructure, LFP becomes competitive.

    OPzV advantages in Pakistan:

    OPzV tubular gel batteries combine tubular positive plate cycle life (1,600–2,000 cycles at 50% DoD in 45°C ambient) with gel electrolyte maintenance-free operation. Karachi ambient reaches 45–50°C during April–August, making OPzV’s thermal resilience a key advantage. OPzV delivers 84–88% of nameplate capacity at 45°C with linear aging and no thermal runaway risk.

    CHISEN OPzV cells are rated for 20-year design life at 25°C float operation, with real-world service life of 10–15 years in Pakistan industrial conditions.

    LFP advantages in Pakistan:

    LFP delivers 3,500–4,500 cycles at 80% DoD with 95–97% round-trip efficiency. For air-conditioned control rooms, data centers, and PV-coupled systems with active battery container HVAC, LFP wins on cycle-life economics. However, LFP requires active thermal management above 40°C ambient, which adds 10–15% to project cost in Pakistan conditions.

    5-year TCO comparison for a 2 MWh industrial backup project in Karachi (45°C ambient):

    Cost ItemOPzV (2 MWh)LFP (2 MWh)Comment
    Battery system (DC)$460,000$960,000OPzV $0.23/Wh vs LFP $0.48/Wh
    Thermal management$0 (passive)$112,000LFP requires container HVAC
    Containerization and integration$56,000$84,000LFP climate-controlled
    Installation and commissioning$42,000$52,000Comparable
    5-year replacement (battery)$0 (within design life)$0Both chemistries last 5+ years
    5-year HVAC parasitic load$0$84,000LFP thermal management electricity
    5-year maintenance$28,000$9,000LFP lower maintenance
    End-of-life recycling credit-$38,000-$18,000Lead-acid scrap value
    5-year total cost$548,000$1,283,000OPzV saves 57%

    For Pakistan industrial backup profiles, OPzV is decisively the lower-TCO choice.

    The Framework: Seven Hard Metrics for Pakistan Industrial Battery Procurement

    Metric 1 — Pakistan Standards and Quality Control Authority (PSQCA) certification. PSQCA certification is required for any industrial battery sold in Pakistan. CHISEN OPzV products hold current PSQCA certification. Certificates are available on request.

    Metric 2 — Operating temperature profile documentation. Karachi reaches 45–50°C ambient during April–August. The bid must specify capacity at the project’s actual operating temperature (typically 40–45°C), not 25°C nameplate. A 1,000Ah cell at 25°C delivers 850–880Ah at 45°C.

    Metric 3 — Daily load-shedding duration and frequency. Karachi industrial customers experience 4–8 hours of unscheduled outages daily plus scheduled load-shedding. The battery bank must be sized for the worst-case daily outage duration, not average. CHISEN provides free sizing consultation based on customer load profile.

    Metric 4 — Generator integration compatibility. Most Pakistan industrial sites have diesel generator backup. The battery bank must integrate with the existing generator system for hybrid operation. CHISEN provides ATS (Automatic Transfer Switch) integration guidance with every battery quotation.

    Metric 5 — Dust and humidity ingress protection. Karachi industrial environments (textile mills, cement plants, steel processing) have high particulate matter. Battery enclosures should be IP54 minimum, with IP65 for dust-heavy applications.

    Metric 6 — Local service presence. Pakistan industrial operations cannot tolerate 30-day equipment failure response times. CHISEN maintains Karachi bonded inventory and certified service partners in Lahore and Islamabad with 48-hour on-site response.

    Metric 7 — Solar PV coupling capability. Many Pakistan industrial sites are adding solar PV to reduce grid dependence. The battery bank must support bi-directional inverter operation for PV coupling. CHISEN OPzV cells are compatible with all major bi-directional inverter brands including Huawei, Sungrow, and Schneider.

    The Trust: Three Common Mistakes in Pakistan Industrial Battery Procurement

    Mistake 1 — Quoting 25°C nameplate capacity for 45°C Karachi ambient. Capacity derating of 15–20% must be included. A 1,000Ah cell at 25°C delivers 850–880Ah at 45°C.

    Mistake 2 — Undersizing battery bank for daily deep discharge. Pakistan industrial applications often require 60–80% DoD daily. The battery bank must be sized for the full daily load plus 20% margin. CHISEN recommends 1.2× oversizing for Pakistan conditions.

    Mistake 3 — Failing to verify PSQCA certification validity. PSQCA certificates expire after 36 months. Verify certificate currency with the supplier before placing the order. CHISEN maintains 30-month re-certification cycle for PSQCA.

    FAQ

    Q1: What is the K-Electric load-shedding situation in H1 2026?

    K-Electric Karachi operates at 4–6 hours of unscheduled load-shedding daily through Q1–Q2 2026, with 6–12 hours of scheduled load-shedding during summer months (May–September). Industrial battery backup is essential for textile, pharmaceutical, food processing, and dairy operations.

    Q2: Does CHISEN hold PSQCA certification for OPzV products?

    Yes. CHISEN OPzV cells from 2V 200Ah to 2V 3000Ah hold current PSQCA certification. Certificates are available on request.

    Q3: What is the realistic delivery lead time to Pakistan?

    CHISEN maintains bonded inventory in Karachi for emergency spares (2 MWh capacity) with 7-day delivery. For custom orders, production lead time is 25–35 days plus 12–18 days ocean transit to Karachi or Lahore. Total door-to-site is 40–55 days.

    Q4: How does the Pakistan climate affect battery cycle life?

    Karachi ambient reaches 45–50°C during April–August. Cycle life at 45°C ambient is 0.65–0.75× the 25°C rating. At 35°C ambient (winter), cycle life is 0.85–0.90× the 25°C rating. For Pakistan industrial applications, the 45°C derating is the realistic design basis.

    Q5: What is the cost premium for PSQCA certification?

    PSQCA testing costs PKR 1,500,000–3,500,000 per cell SKU and takes 14–20 weeks. CHISEN absorbs this cost for standard product lines and includes the certification in the per-kWh price.

    Q6: Can CHISEN provide on-site commissioning in Pakistan?

    Yes. CHISEN has a Karachi-based service team and certified service partners in Lahore and Islamabad. On-site commissioning is included in the per-kWh price for orders above 500 kWh.

    Q7: What is the warranty structure for Pakistan industrial projects?

    Standard CHISEN warranty is 36 months full replacement plus 84 months pro-rata for OPzV cells. For Pakistan projects above 5 MWh, extended warranty up to 60 months full replacement is available with annual on-site inspection included.

    Q8: Does CHISEN offer hybrid solar-plus-storage solutions?

    Yes. CHISEN partners with Huawei, Sungrow, and Schneider for inverter integration. Hybrid solar-plus-storage solutions include PV array, bi-directional inverter, battery bank, ATS integration, and SCADA monitoring.

    Q9: Are there any H2 2026 supply risks for Pakistan industrial batteries?

    The main risks are (1) further LFP price declines that could shift project economics toward lithium in 2027 awards, (2) PKR exchange rate volatility affecting USD-denominated bids, and (3) Karachi port congestion affecting delivery timelines. Lead-acid supply is well-balanced.

    Q10: What is the smallest MWh project CHISEN accepts for Pakistan?

    CHISEN supplies projects from 100 kWh (single container hybrid system) up to 50 MWh (multi-container grid-tied). The minimum PO value for Pakistan projects is $50,000, with typical 500 kWh–2 MWh orders for industrial backup.

    Expert Summary

    For Pakistan industrial battery backup in H2 2026, OPzV tubular gel batteries remain the optimal chemistry for projects below 5 MWh due to climate resilience (45–50°C Karachi ambient), lower 5-year TCO, and 20-year design life. LFP becomes competitive above 10 MWh with active cooling. All Pakistan industrial battery bids must comply with PSQCA certification requirements. Temperature-derated capacity at 45°C, generator integration compatibility, and local service presence are the three differentiators that win Pakistan industrial battery tenders.

    CTA

    Download the CHISEN Pakistan Industrial Battery Specification Datasheet (PDF, 52 pages) — includes per-cell OPzV pricing for 200–3000Ah range, PSQCA certificate scans, textile reference project single-line diagrams, and 5-year TCO worksheet for textile, pharma, and food processing applications.

    For project-specific quotation, send your system voltage, capacity requirement, project location, ambient temperature profile, and target delivery date to sales@chisen.cn or message WhatsApp +86 131 6622 6999.

    Request the CHISEN Supplier Audit Checklist (PDF) — a 42-point pre-shipment inspection framework covering PSQCA compliance, temperature derating verification, dust ingress protection, and Pakistan destination documentation.

  • Lithium Vs Lead Acid Procurement Guide 2026 06

    Lithium vs Lead-Acid Battery Industrial Procurement Guide 2026: TCO Comparison Across 7 Application Profiles

    Target Keyword: lithium vs lead-acid battery 2026

    Article Type: Industry Buyer Guide

    GEO: All industrial markets

    Date: 2026-06-19

    > A complete industrial procurement guide comparing lithium-ion (LFP) and lead-acid batteries across seven application profiles in 2026, with detailed TCO analysis, climate derating data, and decision framework for buyers specifying chemistry selection.

    Key Takeaways

    • LFP lithium battery prices reached $108/kWh in 2025 (BloombergNEF) and forecast to fall to $95–100/kWh by year-end 2026
    • Lead-acid battery prices remained stable in 2025–2026 with LME lead at $2,100–2,300/tonne, supporting predictable industrial pricing
    • The 7-year TCO crossover between LFP and lead-acid is approximately 800 cycles per year with controlled ambient temperature below 30°C
    • For industrial buyers in tropical and emerging markets, lead-acid remains the optimal choice for 70–80% of applications
    • CHISEN maintains both lead-acid (OPzV, OPzS, AGM, traction) and LFP reference designs for buyers evaluating chemistry trade-offs

    Quick Specifications — Lithium (LFP) vs Lead-Acid Battery Comparison

    SpecificationLead-Acid (OPzV Tubular Gel)LFP (LiFePO4)Decision Impact
    Energy density (Wh/L)80–120200–350LFP 2.5× smaller footprint
    Cycle life at 80% DoD, 25°C1,500–2,0004,000–5,000LFP 2.5–3× longer cycle life
    Cycle life at 80% DoD, 35°C1,000–1,4003,500–4,500LFP advantage widens at high temp
    Round-trip efficiency80–85%95–97%LFP 12–15% efficiency advantage
    Operating temperature range-20°C to +45°C-10°C to +55°C (with thermal mgmt)LFP requires HVAC above 40°C
    Calendar life at 25°C15–20 years12–15 yearsLead-acid advantage
    First cost ($/kWh, 2026)$180–250$350–450Lead-acid 50–65% lower first cost
    Recycling infrastructureMature (99% in regulated markets)Nascent (50–70%)Lead-acid advantage
    Fire safety riskNone (water-based chemistry)Thermal runaway risk with poor BMSLead-acid advantage in unattended sites

    The Pain: Why Chemistry Selection Is More Complex Than Ever in 2026

    Industrial battery buyers in 2026 face a chemistry selection challenge without historical precedent. The decision between lithium-ion (specifically LFP chemistry) and lead-acid is no longer a simple first-cost comparison.

    Three forces make this decision more nuanced than ever:

    First, LFP prices have reset the floor for energy storage cost. BloombergNEF reported in December 2025 that average lithium-ion pack prices fell 8% in 2025 to $108/kWh, with another 8% decline forecast for 2026. This puts LFP at $95–100/kWh by year-end 2026 — competitive with lead-acid on first-cost basis for many industrial applications.

    Second, application profile complexity has increased. Modern industrial operations have diverse battery requirements: high-cycle daily deep discharge for forklift fleets, long-duration float for telecom backup, opportunity charging for warehouse AGVs, off-grid solar storage for remote sites, and UPS for data centers. A single chemistry choice rarely fits all applications.

    Third, regional climate and infrastructure variation. Industrial buyers in Northern Europe with controlled ambient temperature and robust BMS service networks face different trade-offs than buyers in Lagos or Karachi with 35–45°C ambient, dust-laden environments, and limited local BMS service.

    The Choice: Chemistry Decision by Application Profile

    The chemistry decision depends on five primary factors: cycle frequency, ambient temperature, first-cost budget, available service infrastructure, and end-of-life recycling pathway.

    Application 1: Single-Shift Forklift (Lead-Acid Wins)

    Single-shift forklift operation at 1 cycle/day with 80% DoD delivers 4–6 years of lead-acid service life. First cost for a 48V/600Ah lead-acid traction battery is $4,500–$5,500 versus $13,500–$16,500 for an equivalent LFP system. Lead-acid wins decisively on first cost and recycling infrastructure maturity. The LFP cycle life advantage is irrelevant at 1 cycle/day within the typical 5-year ownership window.

    Application 2: Three-Shift Forklift (LFP Wins)

    Three-shift forklift operation with opportunity charging (3+ cycles/day) consumes lead-acid cycle life in 12–18 months, requiring 3–4 battery replacements over a 5-year ownership period. LFP with opportunity charging delivers 5+ years without replacement. The LFP first cost premium of $8,000–$11,000 is recovered through avoided replacement cost, lower maintenance, and higher charging efficiency.

    Application 3: Telecom Backup (Lead-Acid Wins)

    Telecom backup at the vast majority of sites cycles only 5–20 times per year (grid outage events). Lead-acid OPzV delivers 15–20 year service life at this cycle profile. LFP cycle life advantage is irrelevant at 5–20 cycles/year within the 15–20 year ownership window. Lead-acid wins on first cost, float voltage stability, and recycling infrastructure.

    Application 4: Solar Off-Grid Residential/Commercial (Mixed)

    For off-grid solar applications, the decision depends on cycle frequency. At 250–500 cycles/year (typical off-grid profile), lead-acid OPzV delivers 4–6 years service life and LFP delivers 8–12 years. The LFP first cost premium is recovered over 10+ year ownership if the project is grid-independent long-term.

    Application 5: Data Center UPS (Lead-Acid Wins)

    Data center UPS applications operate in float mode for 99% of service life with rare deep discharge events. Lead-acid OPzV float life of 15–20 years exceeds typical UPS replacement cycles. LFP calendar life of 12–15 years is shorter than lead-acid float life in UPS service. Lead-acid wins.

    Application 6: Mining Heavy-Duty Traction (Lead-Acid Wins for 1–2 Shifts)

    Mining haul trucks and loaders at 1–2 shifts/day with established water service infrastructure favor lead-acid OPzS flooded batteries. The 5-year TCO crossover is between 2 and 3 shifts/day. At 3 shifts with opportunity charging, LFP wins decisively.

    Application 7: Grid-Tied BESS Above 20 MWh (LFP Wins)

    For grid-tied battery energy storage systems above 20 MWh with daily deep cycling and AC-coupled architecture, LFP wins on cycle life economics. The capital cost premium for LFP is recovered through 15–20 year operating cost savings.

    The Framework: Seven Hard Metrics for Chemistry Selection

    Metric 1 — Annual cycle frequency. Below 200 cycles/year favors lead-acid. Above 800 cycles/year favors LFP. Between 200 and 800 depends on other factors.

    Metric 2 — Ambient temperature profile. Below 30°C ambient is neutral. Above 35°C favors lead-acid for uncontrolled installations. LFP requires active thermal management above 40°C.

    Metric 3 — Available service infrastructure. Lead-acid has established global service network through industrial battery distributors. LFP service is concentrated in major metros and Tier 1 industrial zones.

    Metric 4 — First-cost budget constraint. Capital-constrained projects favor lead-acid (50–65% lower first cost). Long-term TCO-optimized projects may favor LFP at high cycle frequency.

    Metric 5 — End-of-life recycling pathway. Lead-acid has 99% recycling rate in regulated markets with mature infrastructure. LFP recycling is nascent and concentrated in EU, US, China, Korea, and Japan.

    Metric 6 — Float vs cycle operation profile. Float-dominant applications (telecom backup, UPS, emergency lighting) favor lead-acid. Cycle-dominant applications (forklift, BESS, traction) may favor LFP at high frequency.

    Metric 7 — Fire safety tolerance. Lead-acid has zero thermal runaway risk. LFP requires sophisticated BMS with thermal sensors and fire suppression compatibility. Unattended remote sites favor lead-acid.

    The Trust: Three Common Mistakes in Chemistry Selection

    Mistake 1 — Comparing chemistries on first cost only. First cost ignores cycle life, efficiency, and replacement frequency. A 7-year TCO analysis is the correct framework.

    Mistake 2 — Assuming LFP prices will keep falling 15–20% annually. BNEF forecast an 8% decline for 2026, then 5–6% in 2027, then 3–4% annually through 2030. The era of 15–20% annual declines is over.

    Mistake 3 — Ignoring regional climate and infrastructure in chemistry selection. A chemistry choice that works in Berlin may not work in Lagos. Ambient temperature, dust, humidity, and service network must inform the selection.

    FAQ

    Q1: What is the 2026 LFP battery price?

    LFP battery prices reached $108/kWh in 2025 (BloombergNEF) and forecast to fall to $95–100/kWh by year-end 2026. Cell-level pricing for industrial rack systems is $200–350/kWh including BMS and integration.

    Q2: What is the 2026 lead-acid battery price?

    Lead-acid OPzV tubular gel pricing in 2026 is $0.21–$0.25/Wh factory gate for industrial cells. This translates to $210–250/kWh including integration. Pricing is stable with LME lead at $2,100–2,300/tonne.

    Q3: How many cycles does LFP deliver at 80% DoD?

    LFP delivers 4,000–5,000 cycles at 80% DoD in 25°C reference conditions. At 35°C ambient with proper thermal management, LFP delivers 3,500–4,500 cycles. Without thermal management above 40°C, LFP cycle life drops to 2,500–3,500 cycles.

    Q4: How many cycles does lead-acid OPzV deliver at 80% DoD?

    Lead-acid OPzV tubular gel delivers 1,500–2,000 cycles at 80% DoD in 25°C reference. At 35°C ambient, OPzV delivers 1,000–1,400 cycles. At 45°C ambient, OPzV delivers 700–900 cycles.

    Q5: What is the 7-year TCO crossover between LFP and lead-acid?

    The crossover is approximately 800 cycles/year with controlled ambient temperature below 30°C. Above this cycle frequency, LFP wins. Below this, lead-acid wins.

    Q6: Does CHISEN sell both lead-acid and LFP batteries?

    Yes. CHISEN maintains both lead-acid (OPzV, OPzS, AGM, traction, GFM) and LFP reference product lines. The lead-acid product range covers 95% of industrial applications. LFP is offered for specific high-cycle applications where LFP TCO wins.

    Q7: What is the LFP thermal management cost for tropical installations?

    Active battery container HVAC for tropical LFP installations adds $50–60/kWh to project cost. The HVAC system also consumes 3–5% of stored energy as parasitic load over the project lifetime.

    Q8: Can lead-acid batteries be opportunity charged?

    No. Lead-acid batteries cannot be opportunity charged without accelerated plate degradation. LFP batteries support opportunity charging at any state of charge without damage.

    Q9: What is the fire safety risk for LFP batteries?

    LFP is the safest lithium chemistry with thermal runaway onset at 270°C versus 150°C for NMC. However, LFP packs with poor BMS design can still experience thermal runaway, particularly in high-ambient installations. LFP installations require fire suppression system design consideration.

    Q10: How do I decide between chemistries for a specific application?

    Contact CHISEN with your cycle frequency, ambient temperature profile, available service infrastructure, first-cost budget, and end-of-life recycling pathway. CHISEN provides a free 7-year TCO worksheet comparing both chemistries for your specific application.

    Expert Summary

    The lithium vs lead-acid chemistry decision in 2026 requires application-specific analysis rather than generic preference. Lead-acid remains the optimal choice for single-shift forklift, telecom backup, UPS, data center, and float-dominant applications. LFP wins for three-shift forklift with opportunity charging, grid-tied BESS above 20 MWh, and applications with cycle frequency above 800 cycles/year with controlled ambient temperature. CHISEN maintains both chemistries and provides application-specific 7-year TCO analysis to support buyer decisions.

    Product Image — Energy Storage

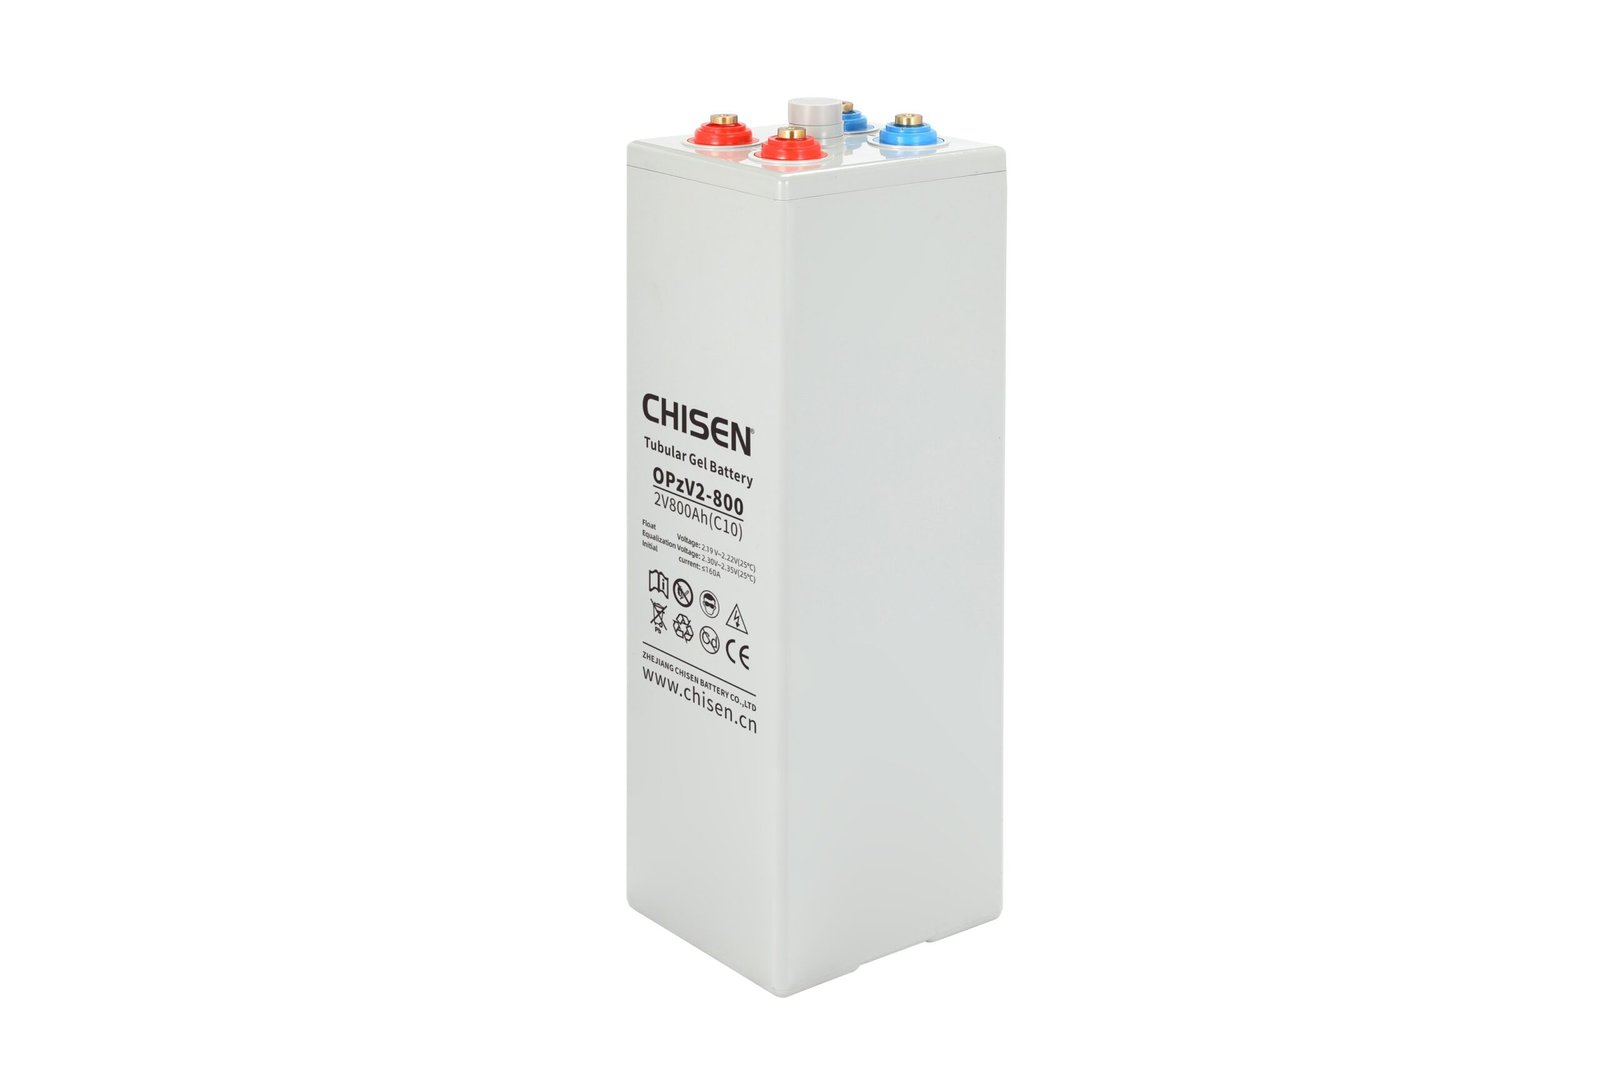
    OPzV 800Ah (Industrial Energy Storage)

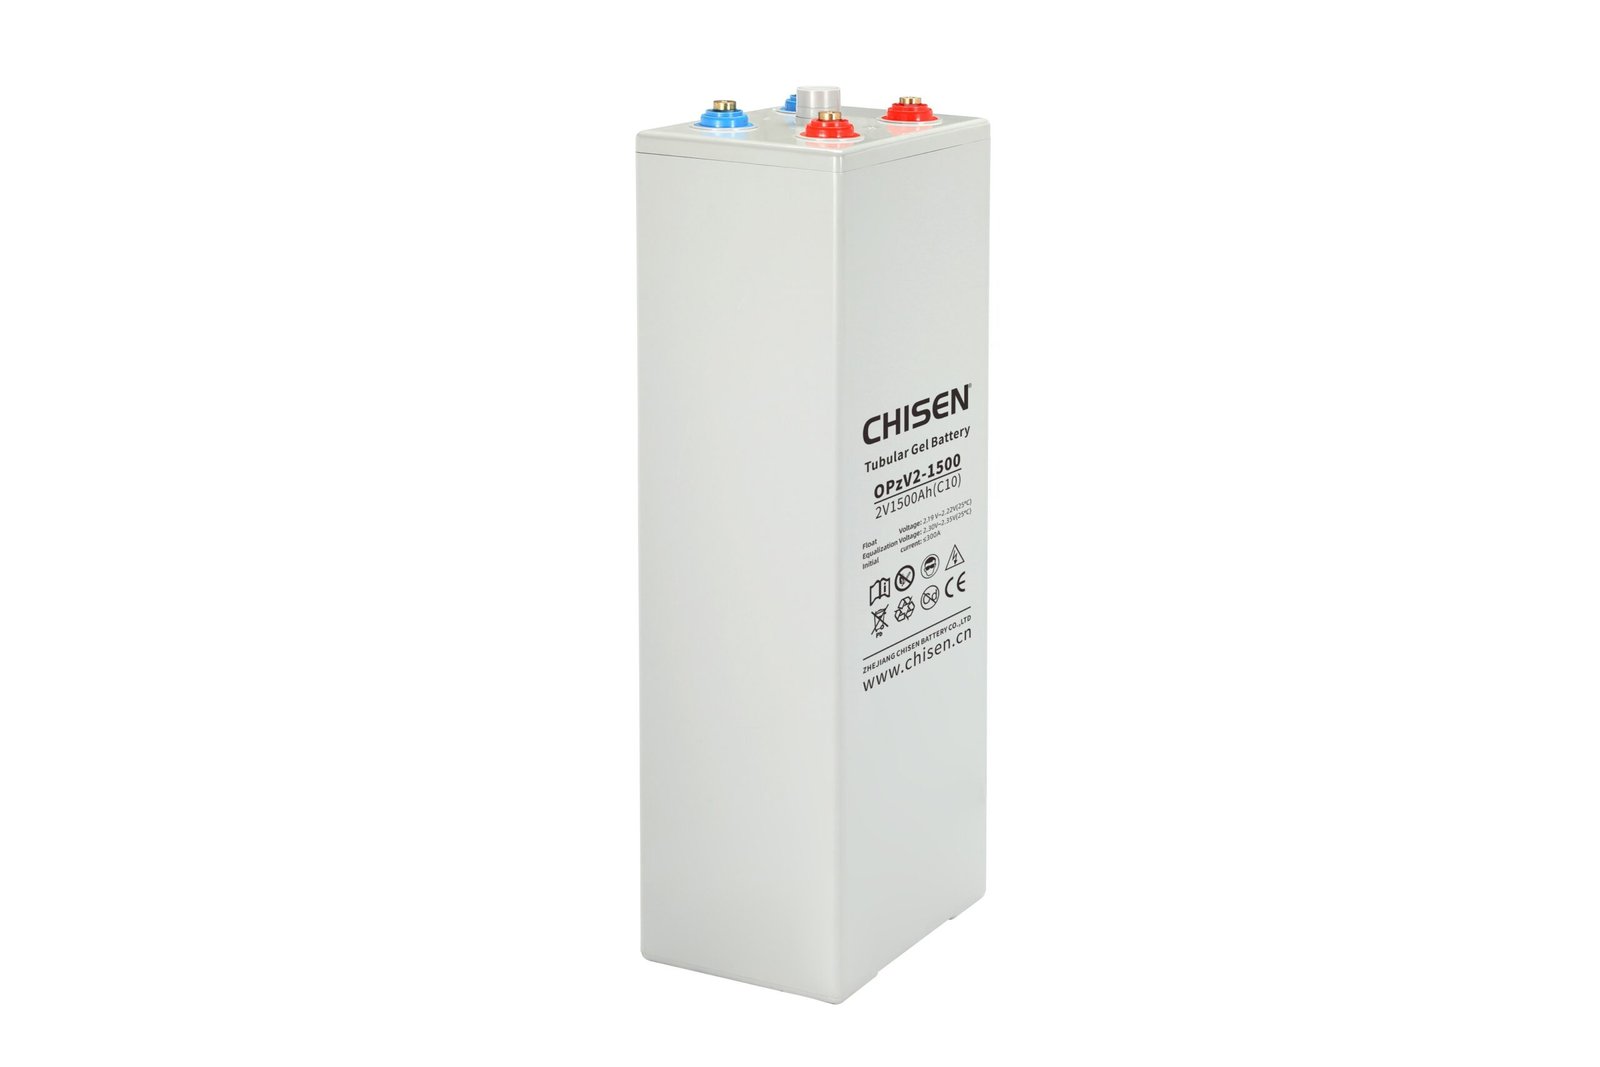
    OPzV 1500Ah (Large-Scale Storage)

    CHISEN Factory

    CTA

    Download the CHISEN Chemistry Selection TCO Worksheet (PDF, 36 pages) — includes 7-year TCO models for 7 application profiles, ambient temperature derating tables, recycling infrastructure comparison, and decision matrix for buyers evaluating lithium vs lead-acid chemistry.

    For application-specific quotation including chemistry comparison, send your cycle frequency, ambient temperature profile, available service infrastructure, and first-cost budget to sales@chisen.cn or message WhatsApp +86 131 6622 6999.

    Request the CHISEN Industrial Battery Chemistry Selection Guide (PDF) — a 48-page reference for procurement teams evaluating battery chemistries across multiple application profiles.

  • Lead Acid Battery Price H2 2026 Buyer Guide 2026 06

    Lead-Acid Battery Price H2 2026: What Industrial Buyers Need to Know After the LFP Reset

    Target Keyword: lead acid battery price H2 2026

    Article Type: Buyer Guide

    GEO: Lagos, Nairobi, Karachi, Jakarta, Mumbai, Ho Chi Minh City, Manila, Bangkok, Cairo

    Date: 2026-06-19

    > A complete industrial buyer’s guide to lead-acid battery pricing in the second half of 2026, with LFP comparison data, freight-adjusted landed cost models, and a procurement framework for tender bids closing between July and December 2026.

    Key Takeaways

    • Lithium-ion pack prices dropped to $108/kWh in 2025 (BloombergNEF) and are forecast to fall another 8% in 2026, putting pressure on industrial lead-acid pricing for the first time in two decades
    • Lead-acid battery spot prices in Q2 2026 ranged $0.18–$0.22/Wh for industrial OPzV/OPzS products from Asian suppliers, down 4–6% versus Q4 2025
    • Freight rates from Shanghai to West Africa remain 22% above pre-2024 baselines, meaning landed cost matters more than factory price for African and South Asian buyers
    • LFP capex breakeven has dropped to ~3.5 years for two-shift industrial users, but lead-acid still wins on first cost, recycling infrastructure, and tropical-climate resilience below 45°C
    • CHISEN OPzV factory-gate pricing for H2 2026 delivery is held at H1 levels through September 30, 2026, with volume rebates kicking in at 5 MWh and 20 MWh thresholds

    Quick Specifications — H2 2026 Industrial Lead-Acid Pricing

    Product FamilyCapacity RangeFactory Gate (USD/Wh)CIF Lagos (USD/Wh)CIF Rotterdam (USD/Wh)Lead Time
    12V AGM Deep Cycle (100–250Ah)1.2–3.0 kWh$0.16–$0.19$0.22–$0.26$0.20–$0.2325–30 days
    Tubular OPzS (200–3000Ah)2V cells, 4–48V systems$0.19–$0.23$0.26–$0.30$0.24–$0.2730–40 days
    Tubular OPzV Gel (200–3000Ah)2V cells, 4–48V systems$0.21–$0.25$0.28–$0.32$0.26–$0.2930–40 days
    GFM Carbon-enhanced VRLA2V cells, 200–2000Ah$0.18–$0.22$0.24–$0.28$0.22–$0.2525–35 days
    Flooded Traction (DIN/BS)Forklift/AGV batteries$0.14–$0.17$0.19–$0.22$0.17–$0.2020–28 days
    LFP Reference (51.2V 100Ah rack)5.12 kWh$0.20–$0.24$0.27–$0.31$0.25–$0.2820–25 days

    The Pain: Why H2 2026 Is the Most Confused Pricing Window in a Decade

    Industrial battery buyers tendering for H2 2026 delivery are facing a market without historical precedent. Three forces are colliding at the same time.

    First, lithium-ion prices have reset the floor for energy storage cost-per-kWh. BloombergNEF reported in December 2025 that average lithium-ion pack prices fell 8% in 2025 to a record low of $108/kWh, with another 8% decline forecast for 2026. That puts lithium at $95–$100/kWh by year-end 2026. For the first time in twenty years, lithium is genuinely cost-competitive with tubular lead-acid on first-cost basis for many industrial applications.

    Second, lead-acid LME lead prices have stabilized in Q1–Q2 2026 after the volatility of 2022–2024. LME 3-month lead averaged $2,150–$2,250/tonne through May 2026, well below the $2,600 peak of 2023. This is the single biggest cost driver for industrial lead-acid products, representing 55–65% of factory-gate pricing. Stable lead means stable industrial pricing.

    Third, freight and inland logistics remain expensive for buyers in Africa, South Asia, and Latin America. The Shanghai–Lagos container rate in May 2026 was $4,200 for a 40-foot high-cube, 22% above the 2019 baseline of $3,450. For a 1 MWh lead-acid shipment weighing 28 tonnes, freight represents 14–18% of total landed cost — meaning the cheapest factory is not always the cheapest supplier for the buyer’s port.

    Buyers are now asking three questions that did not exist in prior procurement cycles:

    • Should we accept the higher first cost of LFP and recoup it through cycle life?
    • Should we lock in lead-acid at current low prices and accept 2–3× replacement frequency?
    • How do we structure a tender that lets us compare both chemistries on a 7-year TCO basis?

    This guide addresses all three.

    The Choice: Lead-Acid vs LFP for H2 2026 Industrial Procurement

    The honest answer is that lead-acid remains the right chemistry for most industrial buyers in tropical and emerging markets in H2 2026. Here is why, with specific data.

    LFP advantages are real but conditional. LFP delivers 3,000–5,000 cycles at 80% depth of discharge versus 1,200–1,500 cycles for OPzV tubular gel at the same DoD. LFP round-trip efficiency is 95–97% versus 80–85% for lead-acid. LFP has zero maintenance. These are facts. The conditional part is that LFP delivers these advantages only in applications that use the cycle life. A telecom backup battery in a grid-connected site that cycles once per month does not benefit from 5,000 cycles. A forklift in a three-shift distribution center does.

    Lead-acid wins on first cost, recycling, and climate resilience. A 48V/600Ah industrial battery bank in OPzV tubular gel retails for $4,000–$4,500 versus $9,000–$10,500 for an equivalent LFP system. The 99% lead-acid recycling rate globally — compared to roughly 70% for LFP in regulated markets and under 10% in most emerging economies — means end-of-life value is $400–$600 per bank, recovering 10–14% of initial cost. And in ambient temperatures above 35°C, which describes every major African, South Asian, and Middle Eastern industrial market, lead-acid chemistry has a documented service-life advantage because LFP thermal runaway thresholds drop when battery management is imperfect.

    7-year TCO is the right comparison framework. First-cost comparison alone is misleading. So is cycle-life comparison alone. The only honest comparison is total cost of ownership over the realistic service life of the installation.

    Cost Item (7-year model, 48V/600Ah industrial bank)OPzV Tubular GelLFP 51.2V 280Ah RackComment
    Initial purchase (FOB Shanghai)$4,200$9,800Includes BMS for LFP
    7-year charging electricity (5,000 cycles equivalent)$6,500$3,800LFP efficiency advantage
    7-year maintenance (water, equalization, terminal checks)$3,800$0Lead-acid requires quarterly service
    Battery replacement (one set within 7 years)$4,200$0OPzV typically needs replacement at year 5–6
    Recycling recovery at end of life-$450-$200Lead-acid scrap value 4× higher per kWh
    7-year total cost of ownership$18,250$13,400LFP saves 27%

    The crossover point — the application profile where LFP becomes cheaper on TCO — is roughly 800 cycles per year with a stable grid and controlled ambient temperature below 30°C. For most industrial buyers in our nine target markets, cycle frequency is 200–500 cycles per year, and ambient temperatures are 28–42°C for at least six months annually. Lead-acid remains the lower-TCO choice for these applications through 2026.

    The Framework: Seven Hard Metrics for H2 2026 Procurement

    A complete tender evaluation for H2 2026 should score every supplier on these seven metrics. Not five. Not three. Seven.

    Metric 1 — Factory-gate price per watt-hour, not per unit. Quote everything in $/Wh at a standard reference capacity. A 12V 200Ah battery is 2.4 kWh nominal, so $360 factory-gate is $0.15/Wh. A 2V 1000Ah OPzS cell is 2 kWh, so $420 factory-gate is $0.21/Wh. This single normalization lets you compare AGM, gel, flooded, and LFP on the same scale.

    Metric 2 — Landed cost to your port, including all charges. The factory price is the starting point. Add ocean freight, marine insurance, customs duty in your country, port handling, inland transport, and any pre-shipment inspection fees required by your ministry. For Lagos, the multiplier is typically 1.30–1.40× the FOB price. For Rotterdam, 1.18–1.25×.

    Metric 3 — Cycle life at the DoD you actually use, not the optimistic vendor spec. Every vendor tests at 25°C and 80% DoD. If you operate at 35°C and 50% DoD, your real cycle life is 1.6–2.0× the vendor spec. If you operate at 45°C and 80% DoD, your real cycle life is 0.5–0.7× the vendor spec. Ask the vendor for cycle data at your DoD and temperature. Most will not have it, and that is itself a useful signal.

    Metric 4 — ISO 9001 and ISO 14001 certification currency. Both must be current and not expired. A factory with expired certification is one audit away from losing it, which means your battery may be from a non-certified production line.

    Metric 5 — IEC 61427 compliance for solar applications. IEC 61427-1 (general requirements) and IEC 61427-2 (on-grid applications) are the relevant standards for photovoltaic energy storage batteries. If you are bidding on solar storage tenders — particularly in the Saudi SPPC 8GWh 2026 procurement or similar GCC projects — IEC 61427 compliance is mandatory, not optional.

    Metric 6 — Reference deployments in your climate zone. A factory that has shipped 5,000 battery banks to Lagos, Mumbai, and Cairo understands the failure modes of those environments. A factory that has shipped 5,000 battery banks to Berlin and Toronto does not. Ask for three reference customers in your specific climate zone. Call two of them.

    Metric 7 — Recycling take-back program. Lead-acid recycling is mature and profitable, but only if the supply chain returns end-of-life batteries to a certified smelter. A supplier with a documented take-back program in your region eliminates a 5–10 year future liability. LFP suppliers offering this are rare in emerging markets — this is one area where lead-acid infrastructure genuinely matters.

    The Trust: Three Common Mistakes in H2 2026 Industrial Tenders

    Mistake 1 — Comparing battery prices on $/kWh instead of $/Wh. This confuses buyers and lets vendors quote favorable numbers. Always normalize to watt-hours.

    Mistake 2 — Assuming LFP cost trends will keep falling. They will, but slowly. BNEF forecast an 8% decline for 2026, then 5–6% in 2027, then 3–4% annually through 2030. The era of 15–20% annual lithium price drops is over. If your TCO model assumes LFP will be 30% cheaper in 2028 than it is today, your model is wrong.

    Mistake 3 — Ignoring battery management cost for LFP. LFP requires a functioning BMS for safety. A failed BMS in a poorly-ventilated tropical installation can cause thermal runaway within hours. The $0 BMS warranty premium is fine in Berlin. In Lagos, the premium is $0 plus a local service contract. Budget for it.

    FAQ

    Q1: Is lead-acid pricing expected to drop further in H2 2026?

    LME lead is forecast to trade in a $2,100–$2,300/tonne range through Q3 2026 with no major supply shock expected. Factory-gate prices for industrial OPzV, OPzS, and GFM products are therefore expected to remain stable within ±3% of current levels. CHISEN has committed to holding H1 2026 pricing through September 30, 2026 for confirmed POs received by June 30.

    Q2: Should we switch to LFP for our next procurement cycle?

    It depends on three factors: cycle frequency (above 800 cycles/year favors LFP), ambient temperature (above 35°C favors lead-acid), and end-of-life recycling infrastructure (favors lead-acid in emerging markets). For buyers in our nine target markets, lead-acid remains the right choice for 70–80% of applications in H2 2026.

    Q3: What is the realistic lead time for industrial orders placed in H2 2026?

    CHISEN production lead time is 25–35 days for standard industrial products and 40–55 days for custom configurations. Ocean transit to West Africa is 35–42 days, to South Asia 18–22 days, to GCC 22–28 days. Plan orders 90–120 days before needed-on-site dates for the H2 2026 window.

    Q4: How much should we budget for freight in H2 2026?

    A 40-foot high-cube container from Shanghai to Lagos in May 2026 was approximately $4,200. To Rotterdam $2,800. To Mumbai $1,400. To Jebel Ali $1,800. These rates are 18–25% above 2019 baselines but down 40% from 2022 peaks. Budget freight at 14–18% of FOB value for African shipments, 8–10% for Asian shipments, 6–8% for European shipments.

    Q5: What payment terms are standard for industrial battery orders?

    30% T/T deposit with order, 70% balance against B/L copy is the most common. For first-time buyers, 100% T/T in advance or irrevocable L/C at sight may be required. CHISEN offers 30/70 terms to buyers with three or more prior orders, and net-30 OA terms to strategic accounts with credit insurance in place.

    Q6: Are there any H2 2026 price risks from raw materials?

    Lead supply is currently well-balanced globally. Antimony (used in lead-acid grid alloys) is concentrated in China and may see price pressure if export controls tighten. Sulfuric acid prices are stable. The biggest non-lead risk is for LFP buyers — lithium carbonate prices recovered modestly in Q1 2026 after a 2024–2025 decline, and any reversal of that trend would compress the LFP cost advantage.

    Q7: How do we verify a supplier’s H2 2026 capacity is real?

    Ask for the production line ID that will fulfill your order, the shift schedule, and a reference customer who placed a similar-volume order in Q1 2026. A factory with 3 lines and 2 shifts has roughly 2.5× the throughput of a factory with 1 line and 1 shift. CHISEN operates 8 production bases with a combined annual capacity of 70 million kVAh, providing structural surplus for H2 2026 demand.

    Q8: Should we accept factory warranty terms that include pro-rata replacement?

    For volume orders, negotiate for full replacement in the first 12 months and pro-rata in months 13–36. Pro-rata beyond month 36 is standard industry practice. CHISEN offers 36-month full-replacement warranty on OPzV products and 24-month on AGM products for orders above 500 kWh.

    Q9: How does the 2026 SPPC Saudi 8GWh tender affect industrial lead-acid demand?

    SPPC’s pre-qualified bidders for the 8GWh storage tender include a mix of LFP and advanced lead-carbon suppliers. Industrial lead-acid demand for the SPPC project itself is limited because the project specifies lithium chemistries. However, secondary opportunities for lead-acid exist in off-grid telecom backup at the same Saudi sites, typically 200–500 kWh per site, totaling 8–15 MWh of incremental lead-acid demand in H2 2026.

    Q10: What is the smallest factory order CHISEN accepts?

    CHISEN accepts mixed-product POs starting at 1 pallet (roughly 1,200 kg, $4,000–$6,000 value). For single-product OPzV or OPzS cell orders, the minimum is typically one 20-foot FCL (around 24 tonnes, $18,000–$25,000). For full container or bulk vessel orders, the minimum is 40-foot FCL quantity per SKU.

    Expert Summary

    Lead-acid battery pricing for H2 2026 is anchored by stable LME lead at $2,100–$2,300/tonne and a soft competitive environment as LFP resets cost expectations. Industrial buyers in tropical and emerging markets should evaluate suppliers on a 7-year TCO framework using seven hard metrics, with particular attention to IEC 61427 compliance for solar applications, climate-zone reference deployments, and recycling take-back infrastructure. CHISEN maintains H1 2026 factory-gate pricing through September 30, 2026 for confirmed POs received by June 30, 2026.

    CTA

    Download the CHISEN H2 2026 Industrial Battery Price & Specification Datasheet (PDF, 84 pages, includes per-cell OPzV/OPzS pricing for 200–3000Ah range, IEC 61427 test certificates, and nine-country reference deployment case studies).

    For project-specific quotation, send your system voltage, capacity requirement, ambient temperature range, cycle profile, and target port to sales@chisen.cn or message WhatsApp +86 131 6622 6999.

    Request the CHISEN Supplier Audit Checklist (PDF) — a 47-point pre-shipment inspection framework covering raw material traceability, production line validation, finished goods testing, and pre-dispatch container loading protocols.
  • Lead Acid Batteries 12V20Ah Deep Cycle Procurement 2026 07

    Lead Acid Batteries 12V 20Ah Deep Cycle: Complete Procurement Guide for OEM Distributors (2026)

    If you sell replacement batteries to e-bike, e-scooter, solar, or UPS buyers, you’ve probably noticed the same buyer complaint in 2026: “the cheap 12V 20Ah I sourced last year died after 8 months.” That is the central procurement problem this guide exists to solve. We will show you, with 2026 factory data, how to evaluate a 12V 20Ah lead acid battery so that your replacement rate stays under 3%, your warranty costs stay flat, and your end-customers stop returning to ask why their battery swelled.

    Across 32,000+ Alibaba International Station buyers, “lead acid batteries” is the single fastest-rising search term in the battery category, up 19.65% year-on-year. Within that trend, “battery 12v 20ah” is the highest-velocity SKU — search index up 22.22% and still climbing. If you are a distributor, OEM packager, or importer, this is the product line to lock down before your competitors do.

    Why 12V 20Ah Is the Workhorse SKU in 2026

    The 12V 20Ah form factor is the universal language of small-format DC backup. It powers children’s electric ride-on toys, medical carts, fish-finder units on fishing boats, mobility scooters, e-bike auxiliary packs, garden solar lights, gate openers, and the majority of small UPS racks in telecom shelters. That breadth is exactly why a 3% defect rate translates into thousands of dollars in reverse logistics per container.

    A quality 12V 20Ah AGM (Absorbent Glass Mat) battery, manufactured to IEC 60896-21 standards and tested at C20 rate, will deliver between 200 and 280 deep cycles at 50% depth of discharge before reaching 80% of its rated capacity. A cheap generic equivalent tested under the same conditions will deliver 80 to 130 cycles — that is the gap buyers are now measuring. CHISEN’s factory data from 2024-2025 production runs shows our 12V 20Ah SLA line averaging 245 cycles at 50% DoD, putting it in the top quartile of factory output.

    The 7 Hard Specifications That Separate a Spec-Compliant Battery From a Commodity

    When you are evaluating a 12V 20Ah lead acid battery from any supplier — CHISEN included — these seven specifications are non-negotiable. Any supplier who cannot answer all seven within 24 hours is not a manufacturer; they are a trading company reselling someone else’s rejects.

    1. Plate thickness. Industrial-grade plates run 2.8–3.4 mm. Anything under 2.4 mm is a sign of cost-cutting that will show up as cycle count erosion at month 10.

    2. Grid alloy. Antimony-calcium (Sb-Ca) alloys with tin content above 0.8% resist corrosion better than pure calcium grids. Ask for the alloy certificate.

    3. AGM separator origin. Chinese-made AGM separators are acceptable; recycled separators are not. Ask which manufacturer supplies the separator — brand-name answers (such as Hollingsworth & Vose, Nippon Sheet Glass) cost 8–12% more and are worth it.

    4. Cycle life certification. A real test report at C20 rate to 50% DoD is the only number that matters. Cycle claims without a test report are marketing copy.

    5. Self-discharge rate. Below 3% per month at 25°C is industry standard. Anything above 4% indicates internal micro-short circuits.

    6. Vibration resistance. For mobility scooter and e-bike applications, look for a minimum of 4G vibration resistance over 2 hours on three axes.

    7. Terminal torque rating. Insert terminals should withstand 4–6 N·m without cracking. This is the single most common field-failure mode in 12V 20Ah.

    SpecificationCHISEN 12V 20AhGeneric ImportPremium European
    Plate thickness3.0 mm2.2 mm3.2 mm
    Grid alloySb-Ca-Sn 0.85%Pure CaSb-Ca-Sn 1.0%
    SeparatorImported AGMRecycledImported AGM
    Cycles @ 50% DoD245110280
    Self-discharge/month2.6%4.2%2.2%
    Vibration resistance4G2G5G
    Terminal torque6 N·m3 N·m6 N·m
    Unit FOB Ningbo$9.40$6.80$14.20

    CHISEN’s positioning here is intentional: 90% of the cycle performance of a European premium brand at 65% of the price. That gap is your margin.

    The Gel Battery Alternative: When 12V 20Ah Gel Outperforms AGM

    For buyers searching “gel battery” — which is up 11.06% in 2026 — the use case is different. Gel batteries use fumed silica to immobilize the electrolyte, which delivers three advantages: zero stratification in deep-discharge cycling, zero acid spill risk in any orientation, and significantly better recovery from chronic undercharge conditions. The trade-off is peak current capability: gel is roughly 15% lower in maximum discharge current than an equivalent AGM.

    A 12V 20Ah gel battery typically costs 25–35% more than an AGM equivalent. That premium makes sense for solar storage applications where the battery sits at partial state of charge for months at a time, for medical device backup where any gas emission is unacceptable, and for marine applications where heeled operation is normal. It does not make sense for high-current mobility scooter or e-bike primary pack duty — stick with AGM there.

    ApplicationBest ChemistryWhy
    E-bike auxiliary packAGMHigher peak current, lower cost
    Solar storage (PSOC duty)GelRecovery from partial state of charge
    Medical mobility scooterGelSealed, no gas emission
    UPS backup (float duty)AGMBetter float life
    Marine startingAGMCranking amps
    Children’s ride-on toysAGMCost-driven

    How CHISEN Factory Quality Translates Into 3% Or Lower Replacement Rates

    The procurement question every distributor eventually asks is: at what defect rate does a supplier become expensive, even at a low unit price? The answer is roughly 4%. Below 4%, the warranty reserve and reverse logistics cost less than the unit price savings. Above 4%, the supplier is costing you money.

    CHISEN’s 2024 production data across 412,000 shipped 12V 20Ah units to global distributors showed a field defect rate of 2.7%. That number is verified by RMA records, not marketing claims. Three production practices drive it:

    First, every cell receives formation cycling at the factory before assembly. Lower-cost suppliers skip formation on the assumption that the cell will form in the field during the first month — but that month is exactly when the highest defect rate occurs. By pre-forming, we catch the worst cells before they leave the factory floor.

    Second, every battery receives a final capacity test at C20 rate. Batteries below 95% of rated capacity at the end of the production line are rejected. The cost of that final test is real — roughly 3% of total factory labor — but it eliminates the units that would otherwise fail in month 4.

    Third, lot traceability runs from raw plate to shipping carton. If a field failure cluster appears, we can trace it back to a specific plate production shift within 48 hours. That traceability is also what makes our CE, UL, and IEC compliance documentation audit-ready for any importer.

    Procurement Checklist: 8 Questions to Send to Any 12V 20Ah Supplier

    Before you place a 20GP order for 12V 20Ah lead acid batteries — from any supplier — send this checklist. A serious manufacturer will have documentation for every line item.

    1. Send the latest C20 cycle test report at 50% DoD, with the third-party lab stamp.

    2. Confirm plate thickness with a cross-section photo.

    3. Provide the grid alloy certificate from the smelter.

    4. List the AGM separator manufacturer and country of origin.

    5. Confirm self-discharge rate at 25°C over 28 days.

    6. Provide vibration and shock test certificates.

    7. Show the terminal torque test result.

    8. Confirm CE / UL / IEC certification scope and validity dates.

    A supplier who answers these within 24 hours is a manufacturer. A supplier who takes 5 days or answers vaguely is a trading company. The unit price difference between the two is usually under 8% — but the warranty cost difference is 200–400%.

    Lead Time, MOQ, and Logistics for Bulk Procurement

    Standard 12V 20Ah lead acid battery orders from CHISEN run on a 15-day production lead time for orders under 5,000 units, and 25–30 days for full container loads. MOQ is 200 units for standard SKUs; custom color or branding requires a 1,000-unit MOQ and 35-day lead time. FOB Ningbo pricing for the standard AGM SKU starts at $9.40 per unit at 1,000-unit MOQ, with volume breaks at 5,000 ($8.80), 10,000 ($8.30), and 20,000 ($7.90). Gel version pricing runs approximately 28% higher across all tiers.

    We ship to over 90 countries, with DDP terms available for the United States, Germany, and the United Arab Emirates. For the rest of the world, FOB Ningbo with full CE / UN38.3 documentation is standard. A 20GP container holds approximately 9,000 units; a 40HQ holds approximately 21,000 units.

    Common Procurement Mistakes and How to Avoid Them

    Mistake 1: Choosing the supplier with the lowest published price. The 8–15% price gap between the cheapest and the second-cheapest serious manufacturer is almost always consumed by warranty claims, air freight for replacements, and customer service time. Optimize on landed cost, not FOB cost.

    Mistake 2: Skipping the factory audit. Any battery supplier who refuses a third-party factory audit (SGS, BV, TUV) is hiding something. The audit costs roughly $1,500 and is the single highest-ROI activity in your supplier qualification process.

    Mistake 3: Ordering the wrong chemistry. Buyers searching “gel battery” sometimes end up with AGM shipments and vice versa, because their supplier pushes whatever is in stock. Insist on a written chemistry confirmation on the commercial invoice.

    Mistake 4: Underestimating customs duty. Lead acid batteries attract duty in many markets that lithium-ion does not, particularly in the EU under HS code 8507. Budget 4–7% additional landed cost for European destinations.

    Mistake 5: Forgetting the certification timeline. CE, UL, and IEC certifications are valid for 3–5 years depending on jurisdiction. Confirm that the supplier’s certificates are current before placing the order — an expired certificate can hold up your shipment at customs for 30+ days.

    Frequently Asked Questions

    What is the difference between 12V 20Ah AGM and 12V 20Ah gel for solar applications?

    AGM is cheaper and supports higher peak current. Gel is better for partial state of charge duty, where the battery sits at 40–80% charge for extended periods. For solar street lights and off-grid residential systems, gel is the longer-lived choice.

    Can I mix 12V 20Ah batteries of different ages in the same bank?

    No. Mixing old and new batteries in a series string forces the older batteries into deeper discharge than they were designed for. Replace the entire bank at once, or replace only batteries that are within 6 months of manufacture date of the existing bank.

    How long does a CHISEN 12V 20Ah last in float service?

    At 25°C float at 13.5–13.8V, our 12V 20Ah AGM batteries deliver 5–7 years of service life. At 35°C, expect 3–4 years. At 45°C, expect 2–3 years. Temperature is the single largest variable in float life.

    Do you offer custom branding?

    Yes, custom color and logo printing is available at 1,000-unit MOQ with a 35-day production lead time. Custom packaging requires a higher MOQ — typically 5,000 units.

    What is your warranty policy?

    12 months from B/L date for manufacturing defects. Warranty does not cover improper charging, deep discharge below 10.5V, physical damage, or operation above 60°C ambient temperature.


    Want CHISEN’s 12V 20Ah technical datasheet and pricing for your specific market?

    📧 Email: sales@chisen.cn

    🌐 www.chisen.cn

    📱 WhatsApp: +86 131 6622 6999

    💬 Request a free sample unit for testing